Data acquisition
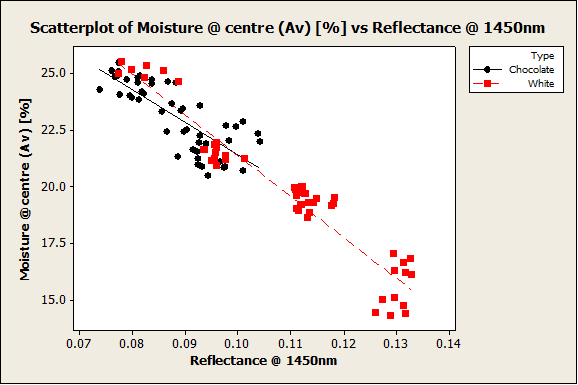
Moisture vs reflectance
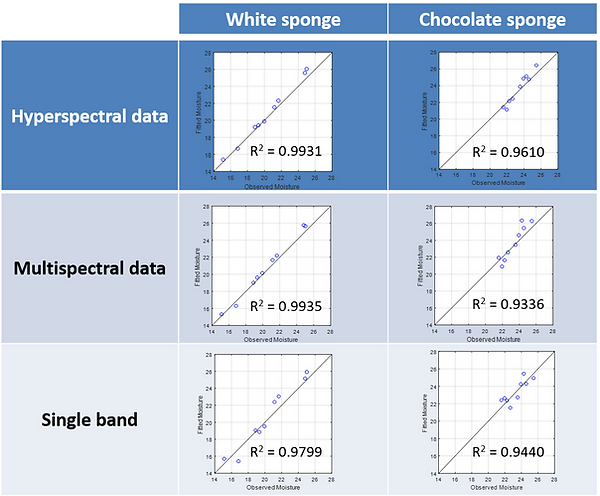
The table illustrates the linearity of the relationship between the predicted and observed data as well as the R-squared values for each prediction.
Although there is an impact of the amount of training data on prediction accuracy, it may be observed that even with single band system the prediction can be performed.
There is strong correlation between measured cake moisture data and the reflectance value at the moisture absorption band
Sponge moisture measurements
-
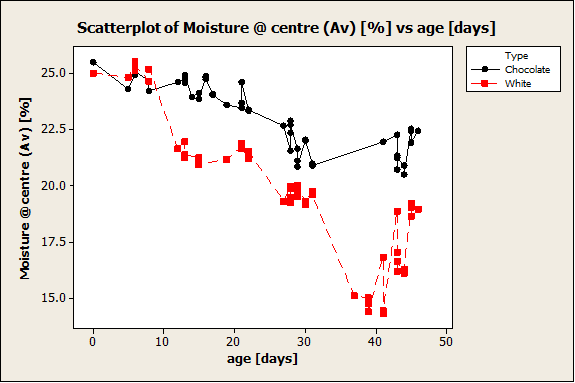
96 sponge cakes (48 white & 48 chocolate) were collected over 6 weeks
-
Sponge age at the time of imaging ranged from a few hours up to 45 days
-
Data collected:
-
Hyperspectral image of each cake - Hyperspectral Camera - inno-spec GmbH, Red Eye 1.7 - passive hyperspectral camera operating in the near-infrared (900 - 1700nm) wavelength range
-
Moisture data - Moisture tester – Mettler Toledo, HB43-S Halogen Moisture Analyzer (2x @ Lightbody)
-
Texture parameters - 1st and 2nd Hardness, Cohesiveness, Springiness, Adhesiveness - Texture tester – Brookfield, CT3 Texture Analyzer (1x @ Lightbody)
-
The moisture of each sampled sponge was tested with the moisture tester, however before this destructive test was done the hyperspectral data of each cake was also acquired.
The variation in the moisture was linked with the observed changes in the sponge structure.

There is strong correlation between measured cake moisture data and the reflectance value at the moisture absorption band
Predicting moisture from HSI
Moisture Data
Partial Least Squares (PLS) Algorithm
PLS Model
HSI Data
Training
PLS Model
Moisture Data
HSI Data
Testing
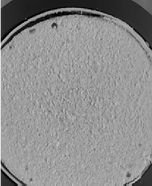
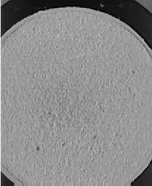
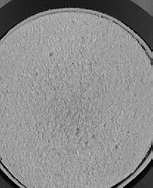
Hyperspectral Imaging - pre-processing
-
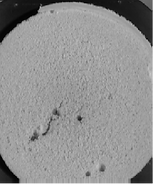
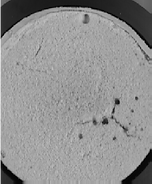
Automatic image processing algorithms were designed and implemented to:
-
Detect the Region of Interest (ROI)
-
Ignore air bubbles
-
Image of the cake with indication of the centre area
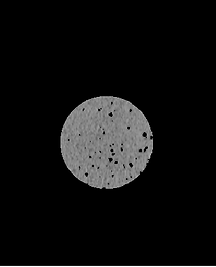

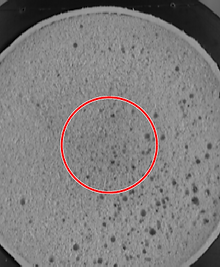

Binary image indicating the air bubbles
Mask for the central region of the cake
Region of interest
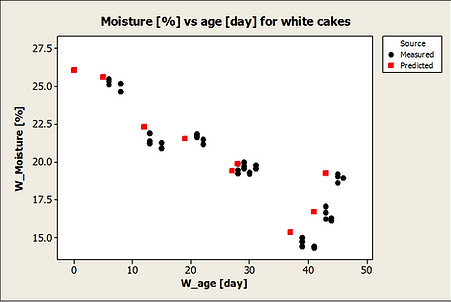
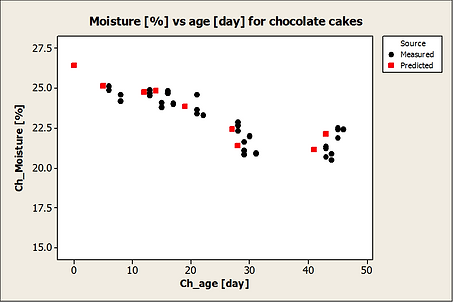
Model performance demonstration
The reflectance based prediction model is able to predict moisture level with high confidence, despite of the cake age or type
Spectral information
A prediction model can be built from:
-
all spectral data
-
a selected subset of bands
-
a single wavelength
Each approach would require different type of camera and will have impact on the overall cost of the setup
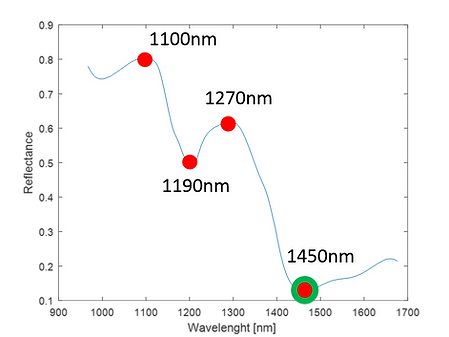
Three different scenarios were explored during this test:
-
Blue curve - hyperspectral data (225 spectral bands)
-
Red points - multispectral data (4 chosen spectral bands)
-
Green circle - single band data (1 chosen spectral band)
Comparison of prediction models